Exploring 100 years of landscape change in BC's Mt. Robson Provincial Park
  • Home
  • About
  • Stations
    • Stn 8: Image 2-16
    • Stn 8: Image 5-16
    • Ptarmigan 1: Image 125
  • Gallery
  • Resources

Stations in the Mt. Robson area

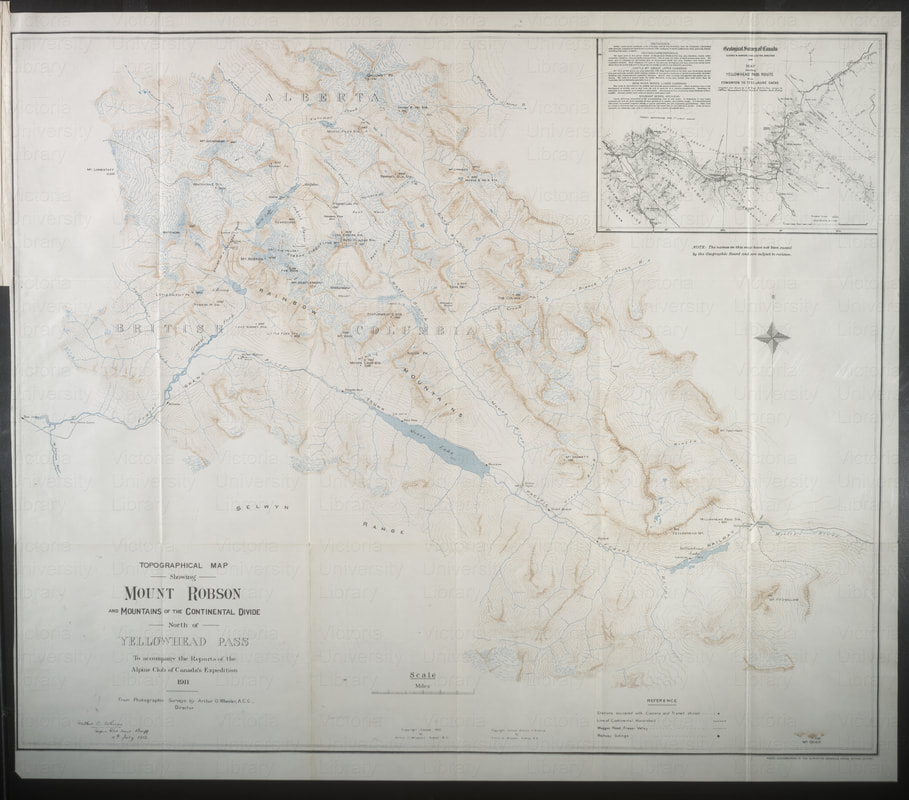
Historic map from the 1911 Survey

Interactive Map of Stations in the Mt. Robson area


This is a copy of the full map produced from data gathered in the 1911 Survey. Click the map to enlarge it.

Picture
Click on a marker to display more information about the station.
Orange markers indicate stations with high resolution digitized historic and modern imagery.
Purple markers indicate stations with high resolution digitized imagery - no yet repeated.
Blue markers indicate known stations, but with as yet no digitized imagery - the images exist only on glass negatives.

Classification Categories

The high resolution image pairs selected for in-depth analysis have been segmented into vegetation and land use categories. These categories are based upon the Vegetation Resources Inventory from the B.C. Land Cover Classification Scheme and are as follows:
Picture
Dense Coniferous Forest. Greater than 60% coniferous forest cover.

Picture
Open Coniferous Forest. Between 15% to 60% of the area is coniferous forest.

Picture
Mixed Wood. Trees cover a minimum of 10% of the area, but neither coniferous nor broadleaf trees account for 75% or more of the total trees.

Picture
Regenerating Area. Land with evidence of recent burning. Fire boundaries clearly identified or clear sign of recent timber harvesting.

Picture
Shrubs. More than 10% of the area is vegetated, less than 10% of the area is treed, and shrubs must constitute 1/3 or more of the total vegetation cover.

Picture
Herbaceous. More than 5% of the area is vegetated, less than 10% of the area is treed, less than 20% is shrub, and herbs must constitute 1/3 or more of the total vegetation cover.

Picture
Barren Ground. Bedrock or fragmented rock broken away from bedrock surfaces. Exposed soil where vegetation cover is less than 5%.

Picture
Glacier. Perennial snow and ice with definite lateral limits, typically flowing in a particular direction.

Picture
Snow Cover. Snow or ice that is not part of a glacier, but is found during summer months on the landscape.

Picture
Wetland. 'Wet' or 'aquatic moisture regime. The water table is at or near the surface, or which is saturated enough to promote wetland or aquatic processes.

Picture
Water. A static body of water. an artificial basin of water (e.g. dam, dyke etc), a river/stream with definable banks. Gravel bars are part of a stream while islands within a stream that have definable banks are not.

Picture
Infrastructure. Cities, towns, villages, hamlets, ribbon development, rural recreation (e.g. rural stores and isolated housing, sub-divisions, cottages, rural residential, acreage owners), transportation, industry.

 
The Vegetation Resources Inventory (VRI) using the B.C. Land Cover Classification Scheme (Version 1.3, 2002), along with Remote sensing and forest inventory for wildlife habitat assessment (McDermid et. al. 2009) were used to create the classification categories. Some condensing of VRI categories occurs in this study because oblique-photographs are used (photos taken from a high point looking out across the landscape at an oblique angle). The VRI does have finer grained category stages but they require othographic imagery (images taken from a high altitude looking down at 90 degrees) in order to be useful.


Guide to Individual Station Pages

Individual station pages present all of the image pairs selected for in-depth analysis. Each page contains the following information:
  • Identification of the historic and modern images in a given pair.
  • An interactive map showing the view in the Mt. Robson area from a given station.
  • A link to the historic and modern image pair in the explore.mountainlegacy.ca website.
  • A link to all of the historic and modern images available from that station.
  • The historic and modern image pair(s) selected for analysis.
  • The historic and modern image pair(s) segmented into vegetation and land use categories.
  • Links to pairwise image analysis comparisons available via the Image Analysis Tool (IAT).
  • Percentage representations of each category in the historic and modern images.
  • Percentage representations of the change between each category in the historic and modern images.
  • Visualizations of selected categories.
  • Discussion of landscape change in the images.


Questions to Keep in Mind while Exploring the Images

Each of the image pairs selected for in-depth analysis as well as other modern and historic images from the stations around the Mt. Robson area can be examined with landscape change in mind.

Questions to keep in mind when examining the images:
  • Is change evident across all vegetation and land use categories in an analyzed image pair? Is change evident in just a few categories, in only one or perhaps none?
  • Do any of the image pairs suggest any factors that might be responsible for the observed change (e.g. climate change, industrial use, settlement, infrastructure, fire, etc.?
  • Do any of the images point to implications for management within/without the Park area?
  • Do the images highlight or point out an area where local knowledge can be used to add context to observed phenomena (e.g. land use/management issues, indigenous use of the land, historical events, etc.)? 
HOME
ABOUT
STATIONS
RESOURCES
Powered by Create your own unique website with customizable templates.
  • Home
  • About
  • Stations
    • Stn 8: Image 2-16
    • Stn 8: Image 5-16
    • Ptarmigan 1: Image 125
  • Gallery
  • Resources